


Which D.C. blocks bake the hottest? City officials are creating a new map to find out
The results will identify the most at-risk communities and shape how the city prepares for longer, hotter summers.

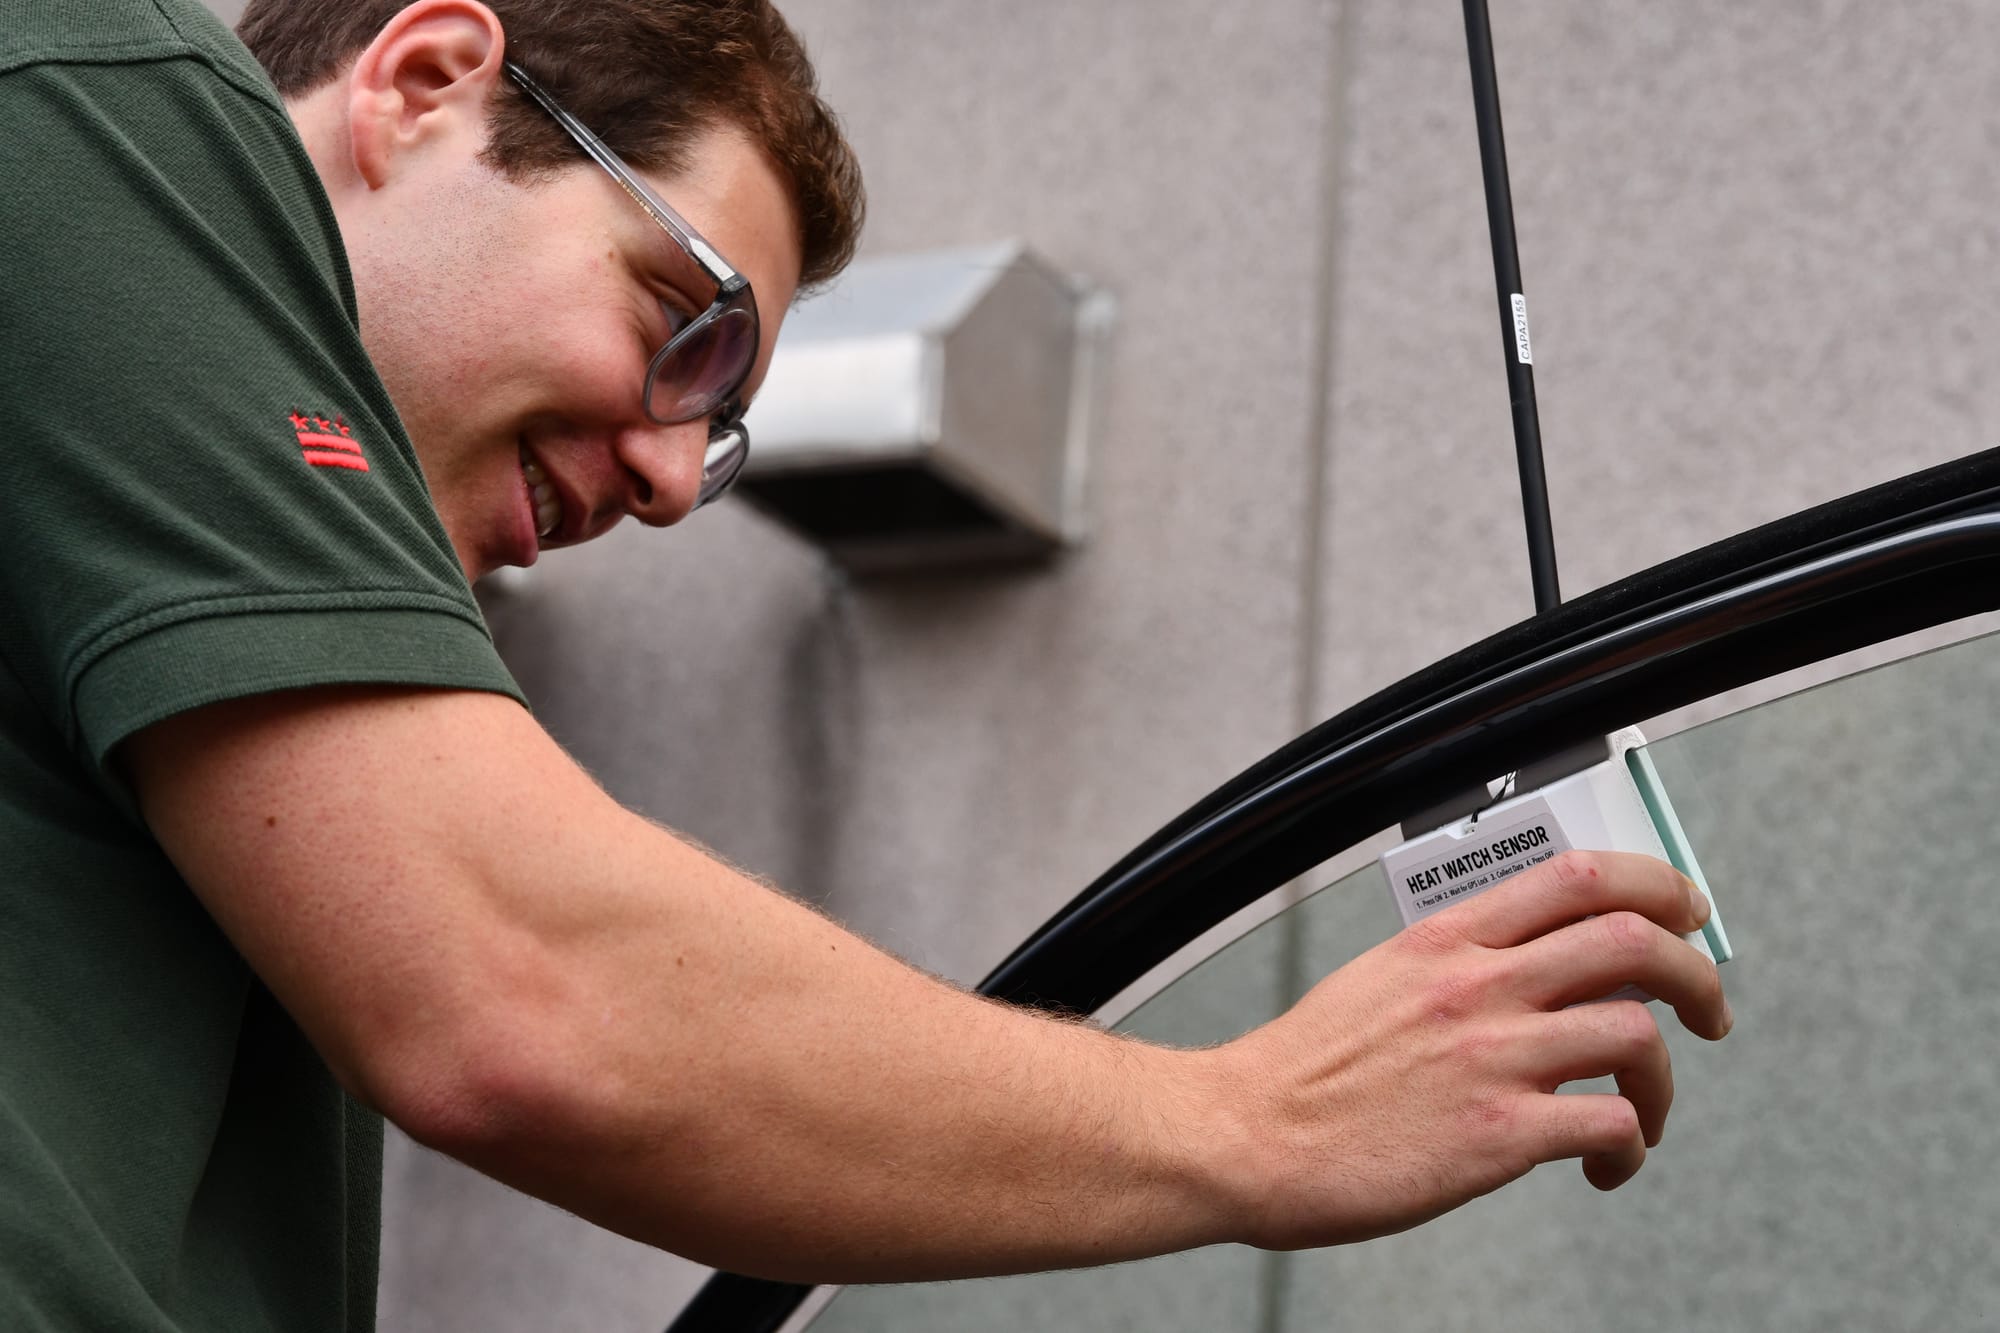
The streetlights were still glowing when Ryan Cafritz steered his Volkswagen Golf out of the Woodridge Neighborhood Library lot in Northeast D.C., a small white heat sensor clipped to the passenger window. Beside him, a colleague from the Department of Energy and Environment adjusted the sensor — about the size of a smartphone, with a thin rod to capture air temperature — and pulled up their route on her phone.
They were one of more than a dozen teams that set out at dawn on August 12. About 50 staff members and a few volunteers drove the same routes again in the afternoon and evening, tracing neighborhoods from Tenleytown to Anacostia and logging temperatures block by block.
The survey, last conducted in 2018, set out to capture something residents already feel every summer: the city is getting hotter, and not all neighborhoods bear that heat equally.
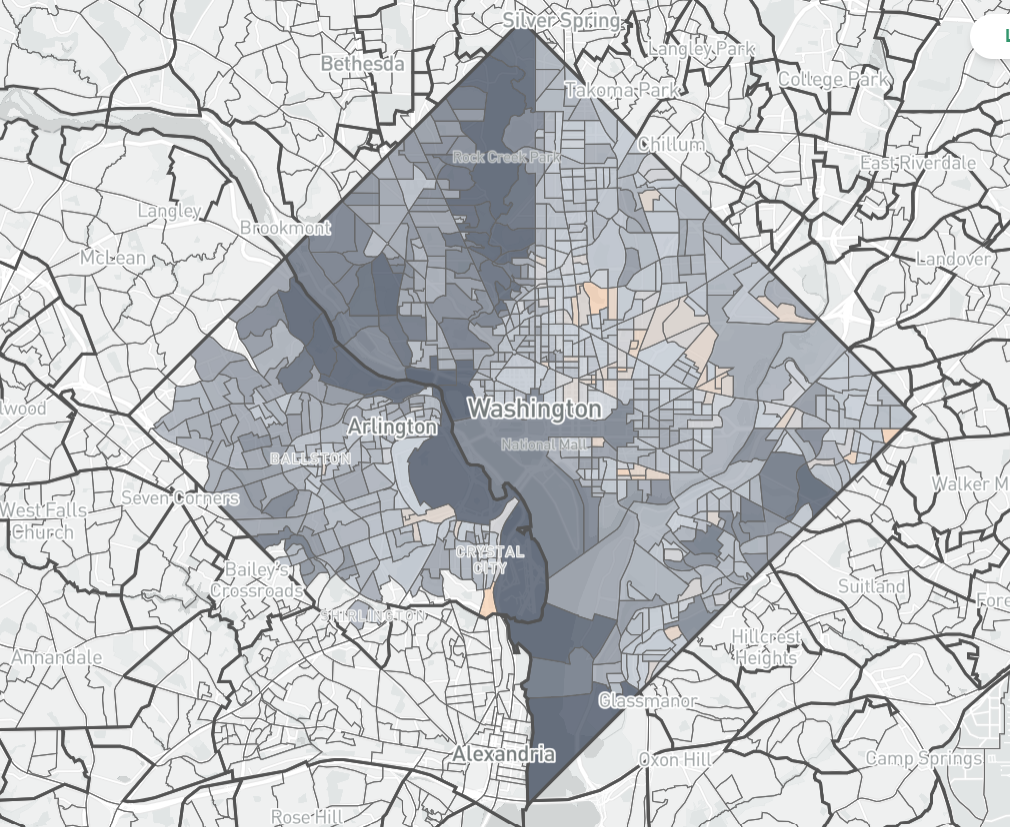
Back then, temperatures varied by as much as 17 degrees across the city, according to Erin Garnaas-Holmes, a climate program analyst and resilience planner at DOEE. Leafier parts of upper Northwest stayed consistently cooler, while heavily paved areas with little tree cover were the hottest.
This year’s report will show whether interventions like tree planting and new green infrastructure have made a dent in those disparities — and where the city still has work to do.
Managing rising temperatures
Extreme heat isn’t just uncomfortable — it’s deadly. The Centers for Disease Control and Prevention estimates that more than 700 people die from extreme heat every year across the country. In D.C., heat waves routinely send residents to the hospital with heat stroke, cardiovascular complications, and respiratory distress, among other health-related issues.
“It lowers your ability to walk, to run errands, to live life truly as it should be lived,” said Cafritz, a green building program analyst at the DOEE, noting that it can disproportionately affect populations like the elderly or people with disabilities.
And the risks are only expected to grow. The city, which historically averaged fewer than 10 days a year above 95 degrees, could see more than 20 such days annually by the 2030s, according to the District’s 2024 Climate Change Projections and Scenario Update. By the 2080s, that number could climb as high as 67 days, with weeks-long stretches of extreme heat becoming routine. The same report warns that more intense rainfall will add stress to D.C.’s stormwater systems and raise the risk of flooding.
City officials note that such extremes threaten to drive up medical costs, increase energy bills, damage infrastructure, and cut into worker productivity.
“We really are marshaling our resources to think about heat, flooding, and extreme precipitation,” Maribeth DeLorenzo, deputy director of DOEE’s Urban Sustainability Administration, told The 51st.
All of this fits into D.C.’s broader climate goals, which include achieving carbon neutrality by 2045. As of 2022, the city had cut its greenhouse gas emissions by about 35% compared to a 2006 baseline, or roughly 3.7 million metric tons of carbon (the equivalent of taking more than 800,000 cars off the road, according to the EPA).
But while the District has made progress toward reducing emissions, its changing climate has also grown “warmer, wetter, and wilder,” DeLorenzo said, which has already brought heavier rains, more flooding events, and longer stretches of humidity.
And the impacts of them don’t fall evenly.
Who faces the greatest risk
The last citywide heat study found the hottest readings in dense, paved parts of the city with little tree cover and heavy development, including Wards 1, 4 and 6, where wide roadways and limited greenery pushed up surface temperatures. The communities most vulnerable to heat-related illness and death, however, were concentrated in Wards 5, 7 and 8, where residents are more likely to be lower income, older, or living with chronic health conditions that make extreme heat harder to withstand.
By contrast, the tree-lined streets and abundant parkland in Wards 2 and 3 consistently recorded some of the coolest temperatures in the city, particularly in and around Rock Creek Park.
Where exposure and vulnerability overlapped, the risks were highest. Ivy City in Ward 5 stood out as one of those neighborhoods. With little shade and long stretches of asphalt, warehouses, and industrial buildings, it functions as what planners call an “urban heat island.” Residents there not only face some of the city’s highest temperatures but also higher rates of heart disease, obesity and disabilities, along with larger shares of people of color and low-income households, according to a 2022 DOEE report.
Garnaas-Holmes noted the city has been using the 2018 heat-mapping data to guide projects such as the Ivy City Climate Resilience Strategy, which aims to develop a flood and heat mitigation plan for the neighborhood.
“We think being climate-ready means ensuring that the District thrives despite challenges brought on by climate-related incidents,” he said. “This means building resilient infrastructure and supporting residents and businesses, but it also means protecting aspects of the city that residents love.”
Meanwhile, development pressures often run up against sustainability goals. A City Paper investigation this year found that Ward 8 lost more healthy trees to development projects in the past five years than any other ward. And DeLorenzo pointed to NoMa as an example of a neighborhood that has seen explosive growth in new buildings but remains one of the city’s hottest areas because pavement far outweighs trees.
“In recent years, we've had some setbacks because of… the pressure of development, she said. “They're not necessarily competing goals, or they shouldn't be, but there is some tension between development and tree canopy.”
Cooling the city
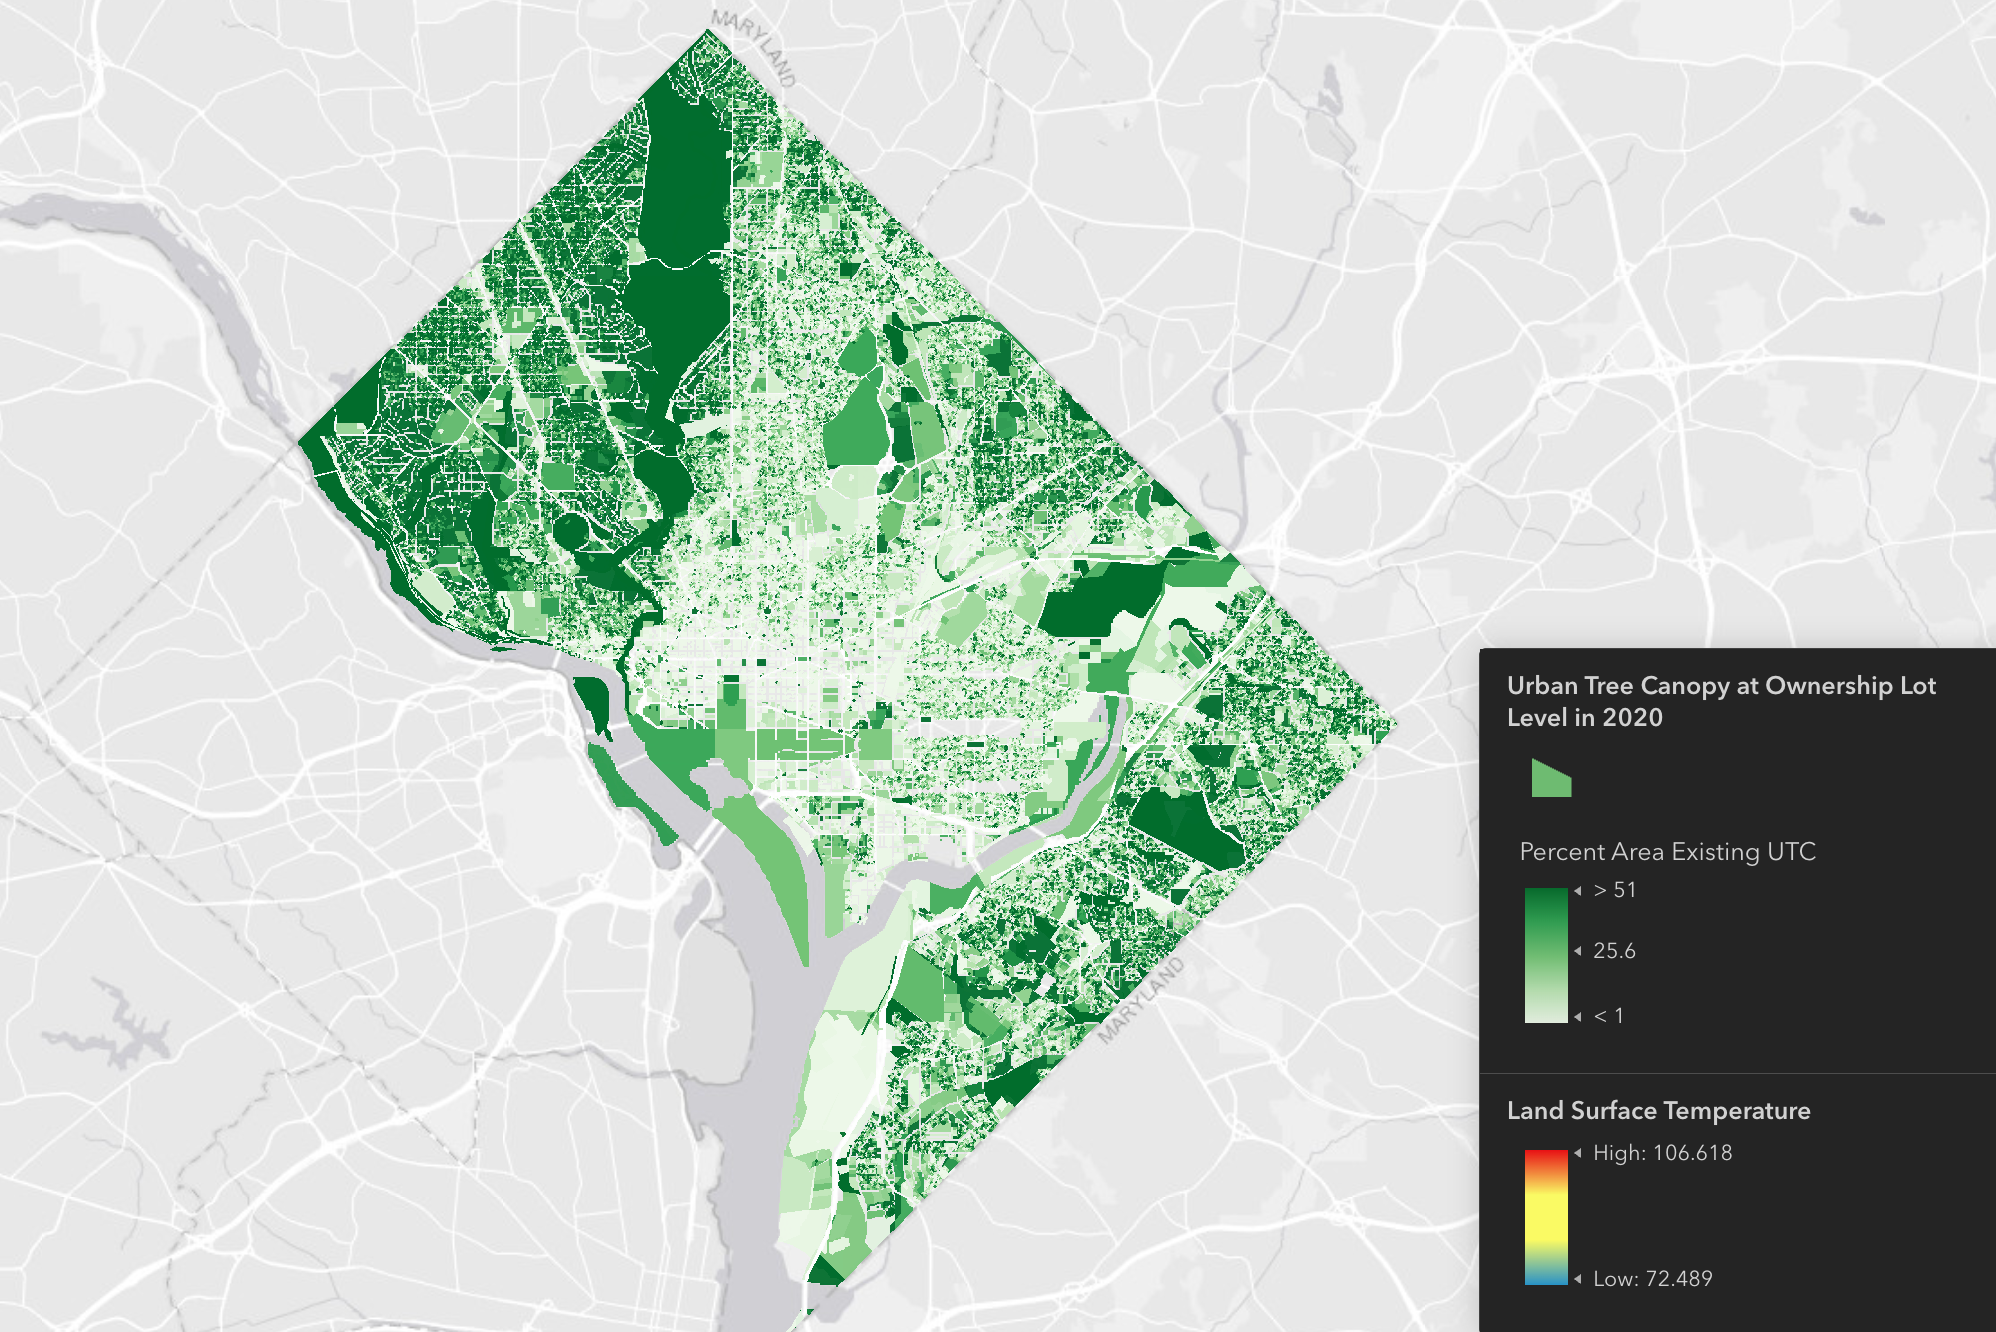
In addition to absorbing carbon dioxide, tree canopies can lower surface temperatures by several degrees, reduce energy demand by cutting the need for air conditioning, and help manage stormwater by soaking up rainfall before it overwhelms drains.
The District plants about 6,000-8,000 new trees each year, according to DOEE officials, though it remains distributed unequally across the city, with more coverage clustered in wealthier wards 3 and 4.
The city is also exploring solutions such as expanding green roofs, testing zoning changes to account for future climate conditions, and piloting a volunteer “heat ambassador” program that would train residents to check on neighbors during heat emergencies.
“We have a community partner that's training people in the community to say, ‘I'm trained in CPR. I have knowledge around heat and heat stroke, and heat exhaustion, and I'm committed to checking on my neighbors in extreme heat,’” DeLorenzo said.
She also pointed to a new pilot by DDOT that uses “cool pavement” — a reflective coating applied to roadways — to lower surface temperatures in places where trees can’t grow, such as large intersections.
The data collected this month will be used to determine where such projects are most needed. It
is still being processed and won’t be published until later this year or early next year; once released, it will be posted on the city’s Open Data portal.
But Cafritz says the toll is clear even without the final numbers.
"Driving through D.C. from sunrise to sundown, I was struck by how different the city feels when you're looking for heat. Not only in the air, but through patterns of shade, pavement, and tree cover,” he said. “Every turn I made reminded me that this data isn't just numbers, but neighborhoods, people, and decisions we make as a community.”

Read next

D.C. healthcare cuts leave low-income residents with fewer options and worse care
Steep city budget reductions mean patients are going without medicine, losing teeth, and living with pain.


As Metro turns 50, transit diehards are keepers of its history, quirks, and identity
They collect memorabilia and create tributes to the iconic system.


The Trump administration is about to kill a popular D.C. bike lane
Feds say the 15th Street protected bike lane will cause more traffic during cherry blossom season, but bike advocates say it makes everyone safer.

With sharp attacks and high stakes, the mayoral race kicks into gear
The three-month sprint to the June 16 primary election is on.